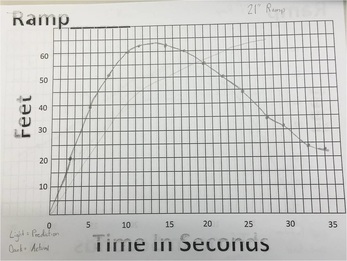
For the first graph (21" ramp) my prediction was very different than the actual graph. i did not account for the fact that the skateboard rolling backwards would result in the graph going downwards.
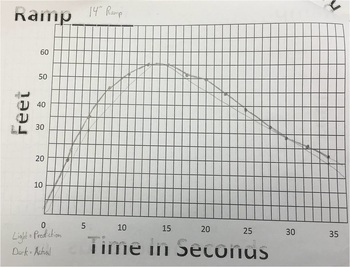
For the second graph (14" ramp) my prediction was very similar to the actual graph. Now that I knew that we had to graph the skateboard when it was rolling backwards.
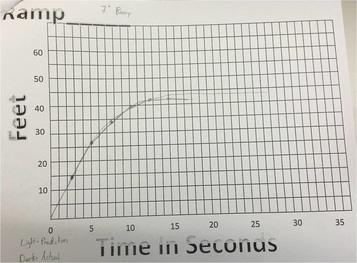
For the third and final graph (7" ramp) my prediction was also very similar to the actual results, but the actual graph was just a little higher than what i had it at.
 RSS Feed
