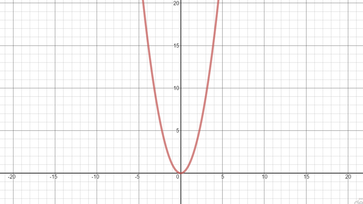
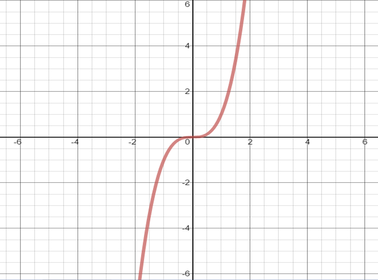
Both even and odd functions have symmetry; Just different types of symmetry. Even functions, like x^2 shown to the bottom left, have vertical symmetry, or symmetry across the Y-axis. This can be represented by the function f(-x)= f(x). Odd functions, like x^3 shown to the bottom right, have symmetry at the origin. this type of function is written f(-x)=-f(x). You can tell if a function is even by folding the graph in half. If the graph is the same on both side it is even. The same is not true for odd functions. You can create a table and if the y-coordinates are inverses of each other then it is an odd function. There isn't a family of functions that are always even or odd; although, some families are mostly even and others mostly odd. For example, squared functions are more often than not even. After this activity, I still it's a little confusing how to determine if a function is odd mathematically. Thanks for reading.
This function follows an exponential curve. The domain is all numbers greater than or equal to zero. The range is also greater than or equal to zero. It's difficult to predict future points on the graph, since their sales have decreased since the 2010. The domain and range will stay the same because the number of downloads can't be negative. There are problems with making a continuous function with the given data points, because next year there will be a new data point, and that will change the curve of the function. Thanks for reading. Based on the parabola that completes the arch of the basketball, the ball will mostly hit the back board and not go in the hoop. You've got some good form, and I like the prominent "flick of the wrist" release you've got goin' on. My only suggestion would be to shoot with the ball a little higher, but other than that, your looking like a solid outside shooter. I left a picture of all-star Michael Jordan's form for reference (not sayin' you need it, but it's there if you want it). Thanks for reading. For the first graph (21" ramp) my prediction was very different than the actual graph. i did not account for the fact that the skateboard rolling backwards would result in the graph going downwards. For the second graph (14" ramp) my prediction was very similar to the actual graph. Now that I knew that we had to graph the skateboard when it was rolling backwards. For the third and final graph (7" ramp) my prediction was also very similar to the actual results, but the actual graph was just a little higher than what i had it at. |
AuthorI'm Julian Moses. this is my blog for Precalc. with Mr. Cresswell. Archives
March 2016
Categories |