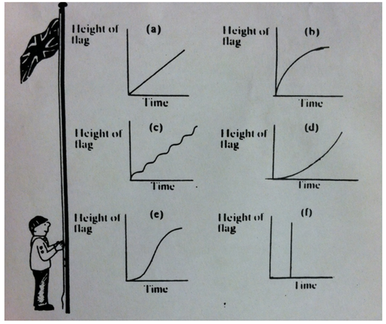
For this assignment, we are given different graphs that are supposed to represent a boy hoisting a flag (seen on the left), and it is our job to describe how the flag is being raised, in terms of time as well as height of the flag. We also have to decide which graphs would/wouldn't realistically portray this event.
In Graph A, the boy would be raising the flag at constant rate. This is also an example of an identity function. In Graph B, the boy started raising the flag fast, but slowed down as time progressed, which creates the curved shape of the graph. In Graph C, the boy was raising the flag in small, constant increments while taking pauses in between pulls. It looks like a diagonal Sine or Cosine function, but that cannot happen in math. In Graph D, the boy started hoisting slow, but sped up as time progressed. This is the opposite of what happened in Graph B. In Graph E, the boy started out slow, then rapidly increased the speed at which he raised the flag, then slowed back down at the end. Graph F is physically impossible, because the graph implies that boy raised the flag from bottom to top in a time frame of zero, which can not happen.
Almost all these graphs could realistically show this event, because there are so many variables that could affect the rate at which a boy raised a flag each morning at his summer camp. if he was tired, it could be Graph B or C. If he was suddenly in a rush to hoist the flag, it could be Graph D. The only graph that does not realistically show this event is Graph F, which was explained in the previous paragraph. Thanks for reading.
 RSS Feed
