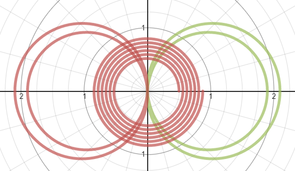
This is what i have created in Desmos using polar equations and graphs. The middle spiral was created using the polar formula r=0.01theta+0.5. This causes the spiral to be wound very tight, but have a gap in the center. The outer 2 graphs look like concentric circle that meet at a tangent point at the origin (0,0). They are mirrored versions of each other, the formula is r=0.1+2cos(theta), but for graph left of the y-axis, the addition sign is changed to a negative. It's the simplicity of the design that makes it beautiful. Thanks for reading.
I learned and memorized a lot more about the unit circle than I had before. I've memorized that every spot on the unit circle increases by π /12 units. This activity also helped me to remember the side lengths/angles of the 30-60-90 and 45-45-90 triangles. Also, this helped explain why sine/cosine = tangent, and why sine is equal to rise, cosine is equal to run, and tangent is equal to the slope. This activity also helped visually connect the unit circle and the coordinate plane. You could see a point on the unit circle and relate it to how you got the answer that's on the plane. I was confident in my answers when you couldn't help us , but some of the questions you asked made me think twice. Thanks for reading. A radian is simply an angle measurement of a circle, just like degrees. A full revolution of the unit circle is equal to 2π radians, or 360°. the formula for the circumference of the unit circle (or any circle) is 2πr. This makes sense because 2π is the circle itself, and the r (radius) would tell you how big or small the circle is; the bigger the radius, the bigger the circumference of the circle , and vise versa. Degrees and radians are interchangeable, you just need to be able to convert the 2 back and forth. To go from degrees to radians, take your angle measure and multiply it by (π/180). To go from radians to degrees, take your angle measure, which should be a fraction including π since you're in radians, and multiply it by (180/π). The π's in each fraction will cancel out. I prefer degrees because we all went through school learning in degrees rather than in radians, but radians seem more accurate because of its connection to the unit circle. Thanks for reading. The question that Cress and Little ask says "If you take out a college loan of $5,000 per year for 4 years, how long would it take to pay it off? research government subsidized loans, non-subsidized loans, and bank loans. What are current interest rates? how are payments and interest calculated?". In short, this question is asking how long would it take to pay off $20,000 using the 3 different types of loans. This all depends on interest rates and what a reasonable amount would be based off your income. If you're using a government subsidized loan, the federal government will pay off your interest while you are still in school, meaning that you will be responsible for paying the interest only after you graduate.
The next option is a Non-subsidized loan. The interest rate is lower than that of the federal subsidized loan, but the non-subsidized loan collects interest while you are in college. Everyone applies for a non-subsidized loan, as opposed to the subsidized loan, where not everyone applies, but the college you go to will cap how much money you can borrow in a non-subsidized loan. Here is the Loan Calculator for a non-subsidized loan. Since you have to pay 4.25% (current rate) in interest for the 4 years you are in college, the total loan amount gets readjusted to $22,289.87. over 10 years (only 6 years after college), you will pay $228.32/mo. The third option is a private bank loan. This is usually the alternative to the federal subsidized loan if you don't apply. This type of loan gains interest while you are in college, and the rate is significantly higher; about 7.5%. With the 7.5% interest rate accumulating through college, your final amount comes out to $24,209.50. after 10 years, you will be paying $24,209.50 monthly. In conclusion, if you can apply for a government subsidized loan, go for it. Thanks for reading.
The distance from Earth to the moon is 238,900 miles, or 15,136,700,000 inches (we'll call it 15 billion for the sake of convenience). Now, the question is: how many folds would it take to fold a piece of paper that high?
You would start with 0.005 inches (width of the paper), an increase it exponentially for every time you folded the paper in half. This results in 42 folds to reach 15 billion inches (distance to the moon). This would never happen in real life because you could never fold a piece of paper that many times; the world record is 12 folds. The paper would also have to be incredibly big, and would be incredibly small by the time you got to 42 folds. Fun fact, if you were to fold a standard piece of paper 103 times, the paper would be bigger than the observable universe; 93 billion light-years across. Thanks for reading. Both even and odd functions have symmetry; Just different types of symmetry. Even functions, like x^2 shown to the bottom left, have vertical symmetry, or symmetry across the Y-axis. This can be represented by the function f(-x)= f(x). Odd functions, like x^3 shown to the bottom right, have symmetry at the origin. this type of function is written f(-x)=-f(x). You can tell if a function is even by folding the graph in half. If the graph is the same on both side it is even. The same is not true for odd functions. You can create a table and if the y-coordinates are inverses of each other then it is an odd function. There isn't a family of functions that are always even or odd; although, some families are mostly even and others mostly odd. For example, squared functions are more often than not even. After this activity, I still it's a little confusing how to determine if a function is odd mathematically. Thanks for reading.
This function follows an exponential curve. The domain is all numbers greater than or equal to zero. The range is also greater than or equal to zero. It's difficult to predict future points on the graph, since their sales have decreased since the 2010. The domain and range will stay the same because the number of downloads can't be negative. There are problems with making a continuous function with the given data points, because next year there will be a new data point, and that will change the curve of the function. Thanks for reading. Based on the parabola that completes the arch of the basketball, the ball will mostly hit the back board and not go in the hoop. You've got some good form, and I like the prominent "flick of the wrist" release you've got goin' on. My only suggestion would be to shoot with the ball a little higher, but other than that, your looking like a solid outside shooter. I left a picture of all-star Michael Jordan's form for reference (not sayin' you need it, but it's there if you want it). Thanks for reading. For the first graph (21" ramp) my prediction was very different than the actual graph. i did not account for the fact that the skateboard rolling backwards would result in the graph going downwards. For the second graph (14" ramp) my prediction was very similar to the actual graph. Now that I knew that we had to graph the skateboard when it was rolling backwards. For the third and final graph (7" ramp) my prediction was also very similar to the actual results, but the actual graph was just a little higher than what i had it at. |
AuthorI'm Julian Moses. this is my blog for Precalc. with Mr. Cresswell. Archives
March 2016
Categories |